Article • 7 min read
How to leverage the exponential smoothing formula for forecasting
Using exponential smoothing to predict your future sales will give you the data you need to make the best decisions in every area of your company.
By Josh Bean, Director, Marketing
Last updated February 15, 2022
When it comes to setting quotas, sales managers like to turn to a quick and easy annual run rate (ARR). But we’ve seen that an ARR is far from the most precise metric.
Though the exponential smoothing formula is a more complicated sales forecasting method, it is arguably better and can be used to more accurately predict product life cycles, future sales, and even the number of virus infections across a variety of industries. As such, we think using the exponential smoothing forecasting method provides you with the data you need to make the best decisions in every area of your company.
What is exponential smoothing?
Exponential smoothing is a way of analysing data from specific periods of time by giving more importance to the newer data, and less importance to the older data. This method produces “smoothed data,” or data that has the noise removed, allowing patterns and trends to be more visible.
When it comes to projecting sales, the interpretation of data run through an exponential smoothing forecast gives this method an edge because the exponential smoothing formula assigns more weight to the most recent sales performance data. For example, if you are using exponential smoothing to analyse 12 months’ worth of sales revenue, the exponential smoothing formula will put more weight on last month’s earnings than on the prior year’s.
That’s one of the biggest differences between exponential smoothing forecasting and a simple annual run rate. A run rate will project out numbers from one period to an entire year, assuming those numbers will remain steady going forward. With exponential smoothing, you can decide how much weight is placed on more recent data by choosing a smoothing constant between .1 and 1 (the (α) in the formula below) in your exponential smoothing formula. The larger the value of the constant, the more weight given to recent data.
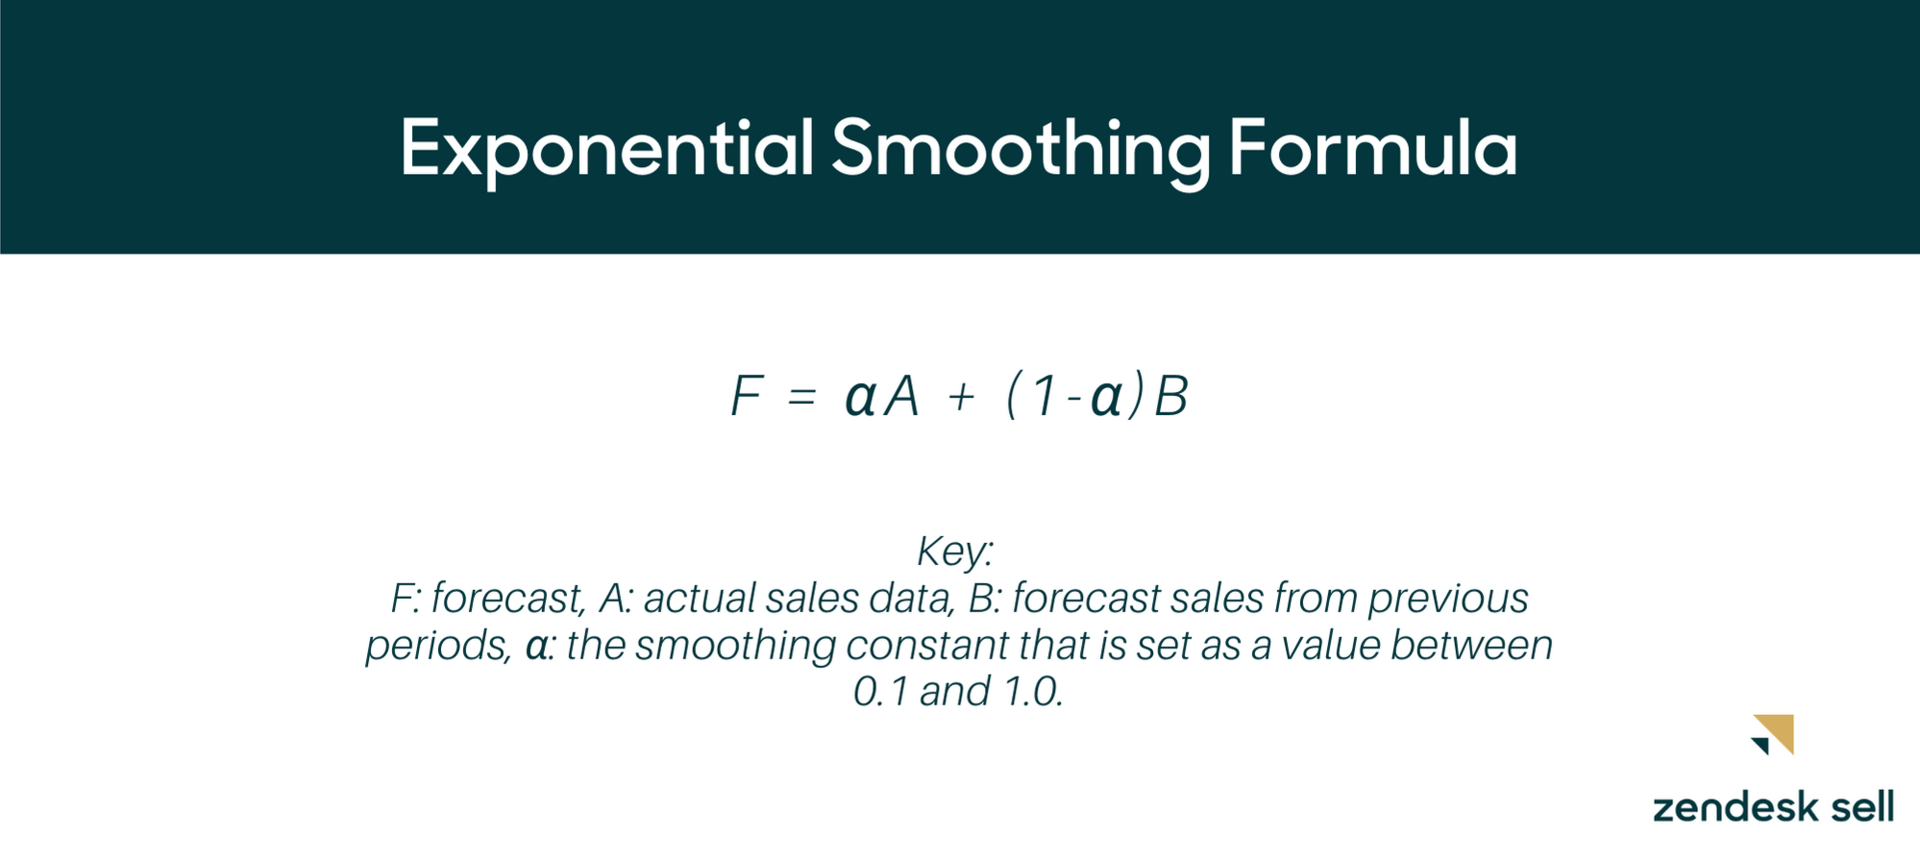
If algebra was your least favourite subject in school, you may have broken into a cold sweat at this point. Don’t worry—with Excel, running an exponential smoothing forecast is easy, as the calculations are done for you.
How to set up an exponential smoothing forecast in Excel
The good news is that you don’t need to be a math major to perform exponential smoothing calculations. In fact, if you have a recent version of Excel, you don’t even need to choose your own smoothing constant. While older versions of the programme require you to manually enter the smoothing constant, the newest versions of Excel will automatically determine that portion of the equation for you.
Nowadays, when it comes to smoothing your own sales data, all you need to know is how to use the Excel built-in exponential smoothing model or function FORECAST.ETS.
Step one: Create a worksheet with your data
To get started setting up your exponential smoothing forecast, organise your data into a chart like the one below.
Tip: Your timeframe or sales data may look different. The example below organises data by month and in dollar amounts. But you might, for example, organise your data by quarters and units sold.
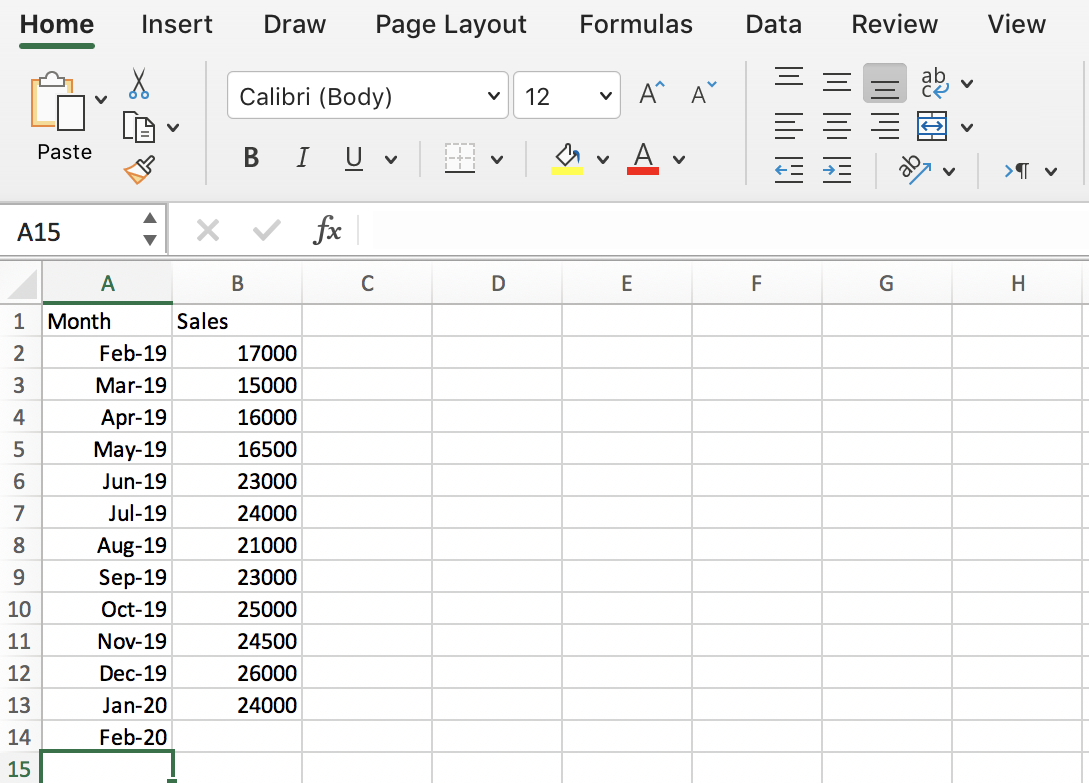
Step two: enter your target date
Choose a separate cell on the same worksheet, and enter your target date—the future month, quarter, or year that you’re attempting to forecast with the exponential smoothing model. When using this model, it’s important to remember that exponential smoothing forecasts become less accurate the further into the future they predict.

Step three: Run the excel forecast.ets function
At this point, you can create a separate “Sales Forecast” column by adding in the function FORECAST.ETS. This formula will use exponential smoothing to predict the sales for the target date added in Step Two.
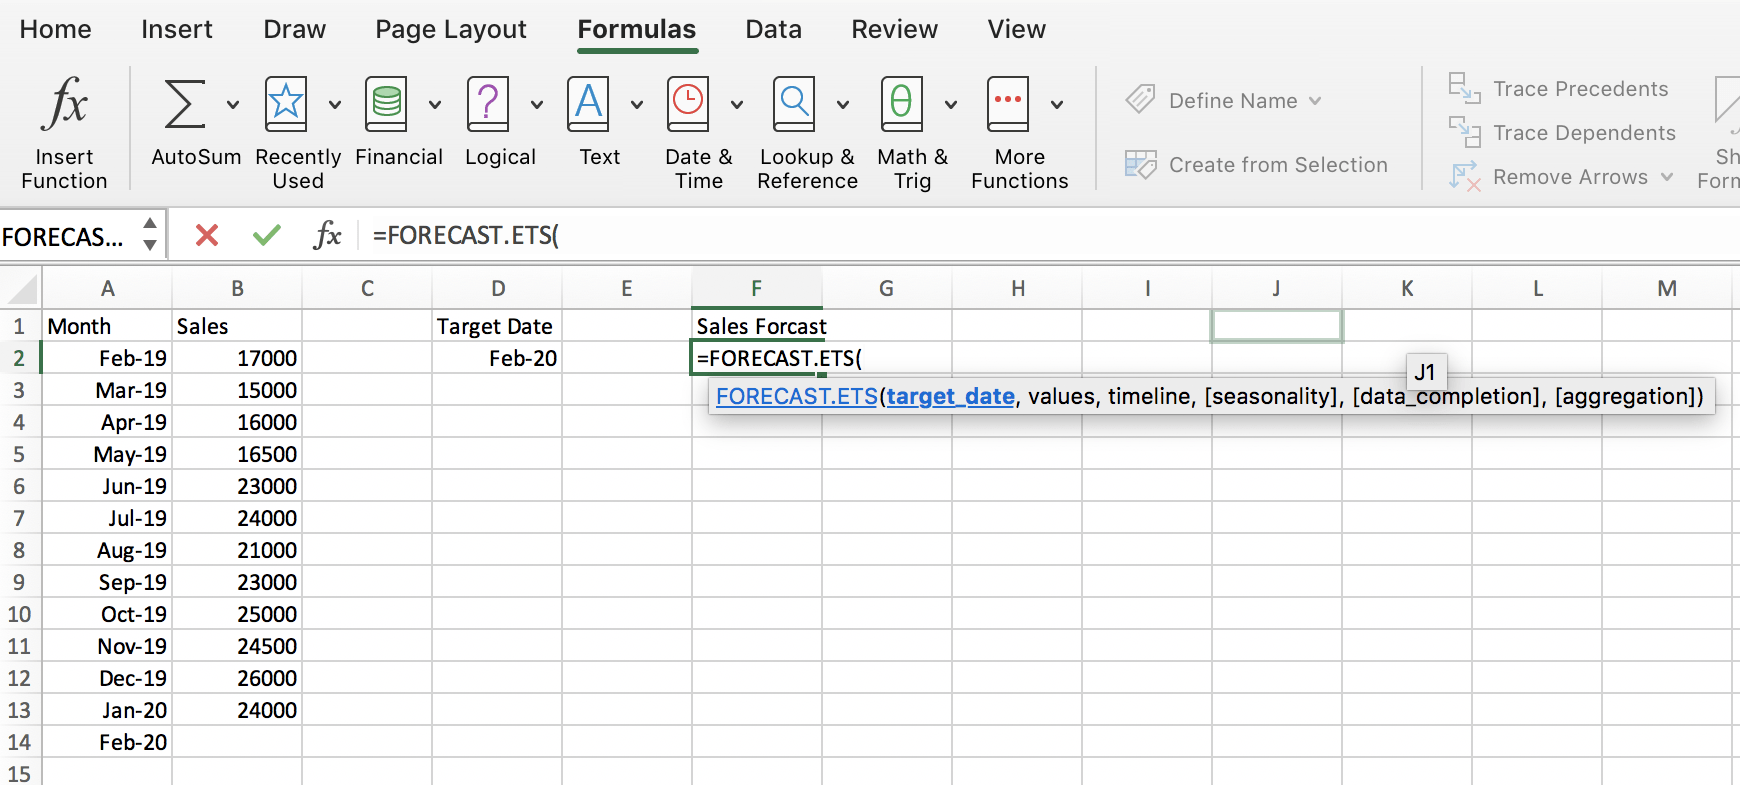
The FORECAST.ETS formula will prompt you to enter data for the following fields:
Target Date:This is the date you’re trying to forecast. In our example, this is cell D2.
Values: This is the sales data you want to analyse for your forecast. In our example, this is cells B2:B13.
Timeline: This is the period you are analysing for your forecast. In our example, this involves cells A2:A13.
Seasonability: This is an optional feature that will look for seasonal trends in your data and take them into account if you enter a “1.” You could also manually specify the length of the seasonal pattern by entering a positive number, such as 12 for monthly data or 52 for weekly data (it will actually let you go as high as 8,760, the number of hours in a year). We suggest keeping things simple and just entering a “1” until you are comfortable tweaking the exponential smoothing model on your own.
There’s also the option of typing “0” if you don’t want the formula to account for seasonal trends at all.
Data Completion: This optional feature will fill in and complete any data gaps in your data. Enter “1” for data completion or “0” if you want missing values to be treated as zeroes.
Aggregation: This is another optional function that specifies how the function should treat duplicates in your data. It is best to examine your data for any duplicate inputs before you run the exponential smoothing model. This field should not affect your forecast if your data is accurate, so you can enter the default “1.”
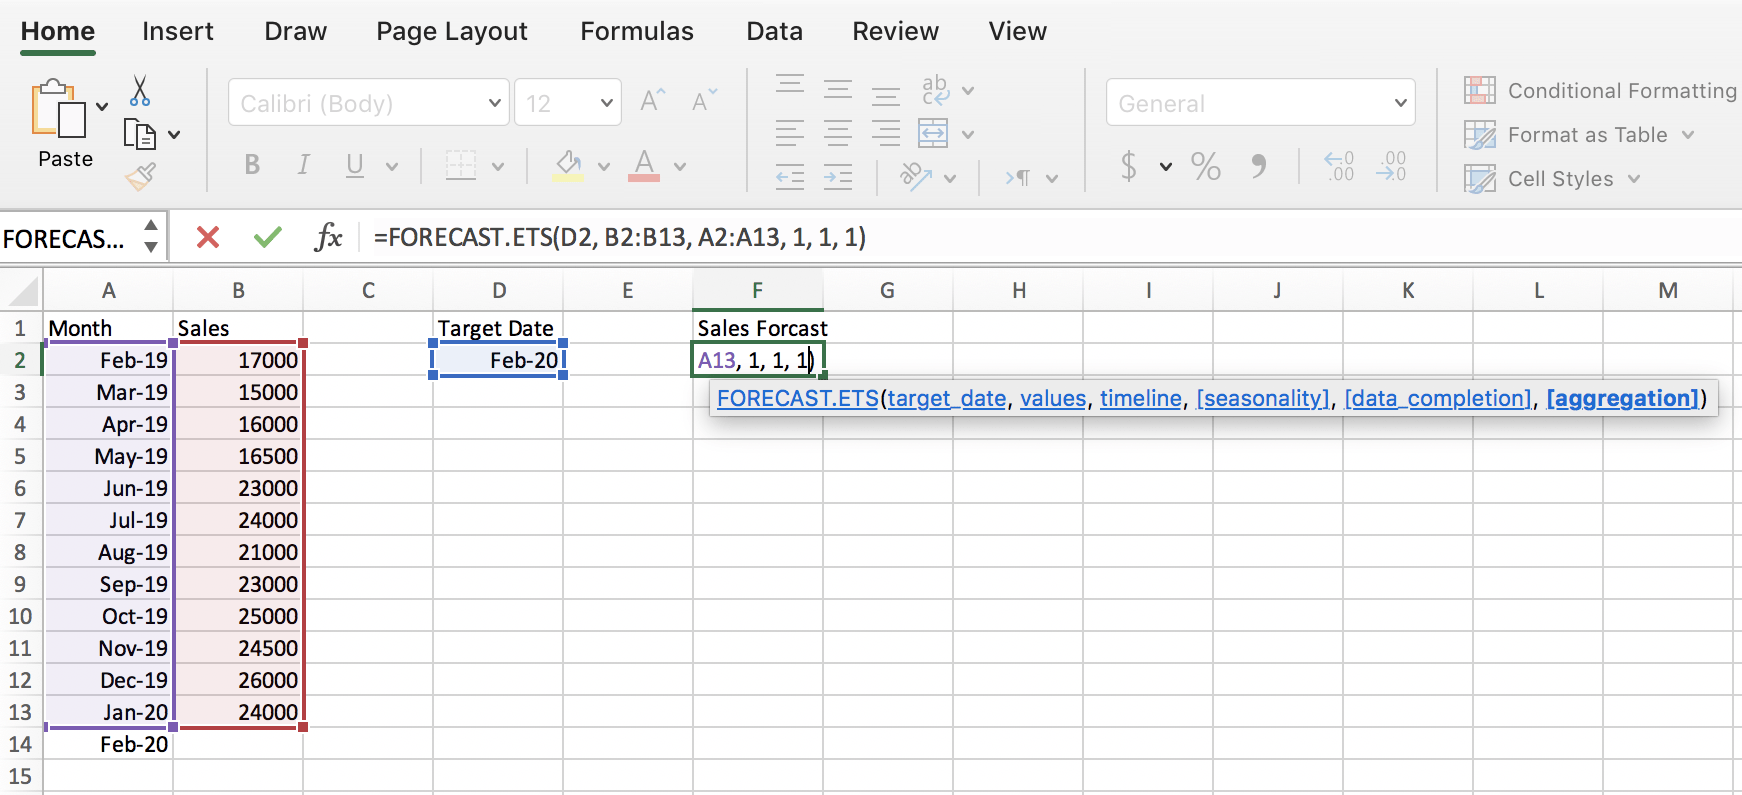
Here’s what the equation looks like with all of the appropriate cell ranges and numbers in their place. Once you fill out all of the values and press enter, you’ll be presented with the sales forecast calculated for your target date based on the exponential smoothing model.

In our example, the predicted sales for our target date is $27,725. If we change the target date, we can also easily see the projection for other months further into the future.
Step FOUR: view your data at a glance
You also have the ability to create a visual forecast worksheet that can make this data easier to process at a glance.
For PC users: Highlight your data>go to the Data tab>click on the Forecast Sheet button>click Create. You’ll be given a helpful line graph.
For Apple Mac users: Highlight both your actual and forecast data, >go to the Insert tab>select a 2-D Line Graph to create your chart.
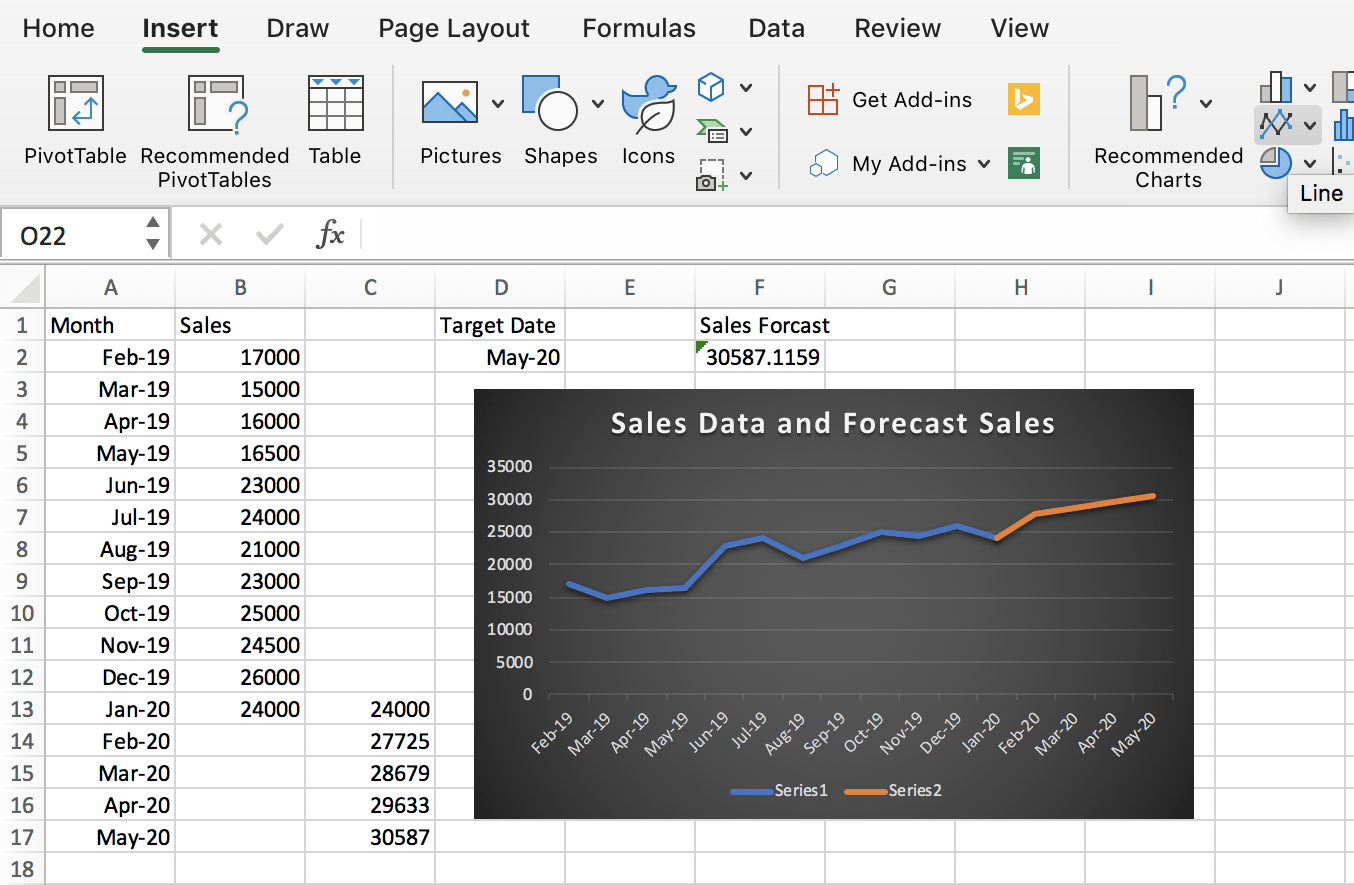
In our example, the actual sales results from the past year are signified by the blue line, while the orange line represents what the exponential smoothing formula forecasts will happen over the next four months. It’s easy to get lost in spreadsheets, but once you have learned how to use the exponential smoothing formula, it is surprisingly simple to understand the forecasts using the tools in Excel.
Improve your bottom line with better forecasting tools
The exponential smoothing model delivers results that can be used to make decisions in many areas, from financial planning to sales quotas. While the exponential smoothing formula may seem complicated at first, with this “how-to” guide, we’ll have you charting sales like a pro in no time. It’s impossible to predict the future exactly, but using the exponential smoothing model allows you to confidently take actions based on your model’s predictions.
Of course, predicting sales is not the only type of forecasting that matters to your company. You’ll also want to know which leads are most likely to pay off, which deals are closest to closing, and how any forecasting tool is going to affect your sales goals and bottom line.
These are the questions answered by Zendesk Sell’s Sales Forecasting feature, which takes your data and automatically calculates and populates sales forecasts with a micro-level focus. As an automated forecasting tool, the feature provides insights into every deal in your pipeline on a dashboard for your sales analytics, including an Estimated Close Date and Win Likelihood for each one.
To learn more, take a look at these essential sales forecasting techniques on how to further leverage your data to create accurate sales forecasts. Thanks to sales reporting tools like Excel and Zendesk, you can operate your business with confidence in your sales forecast data.
